The Information Asymmetry System: Why AI Will Transform Markets

The System Structure
When The Economist declared AI’s war on the “rip-off economy,” they documented a transformation that’s been 50 years in the making. But the real story isn’t just about technology -it’s about feedback loops that have kept information asymmetries stable despite decades of attempted solutions.
Using MIT Systems Dynamics methodology, we can map three interconnected feedback loops that explain both why the problem persisted so long and why AI might actually solve it (while creating new challenges).
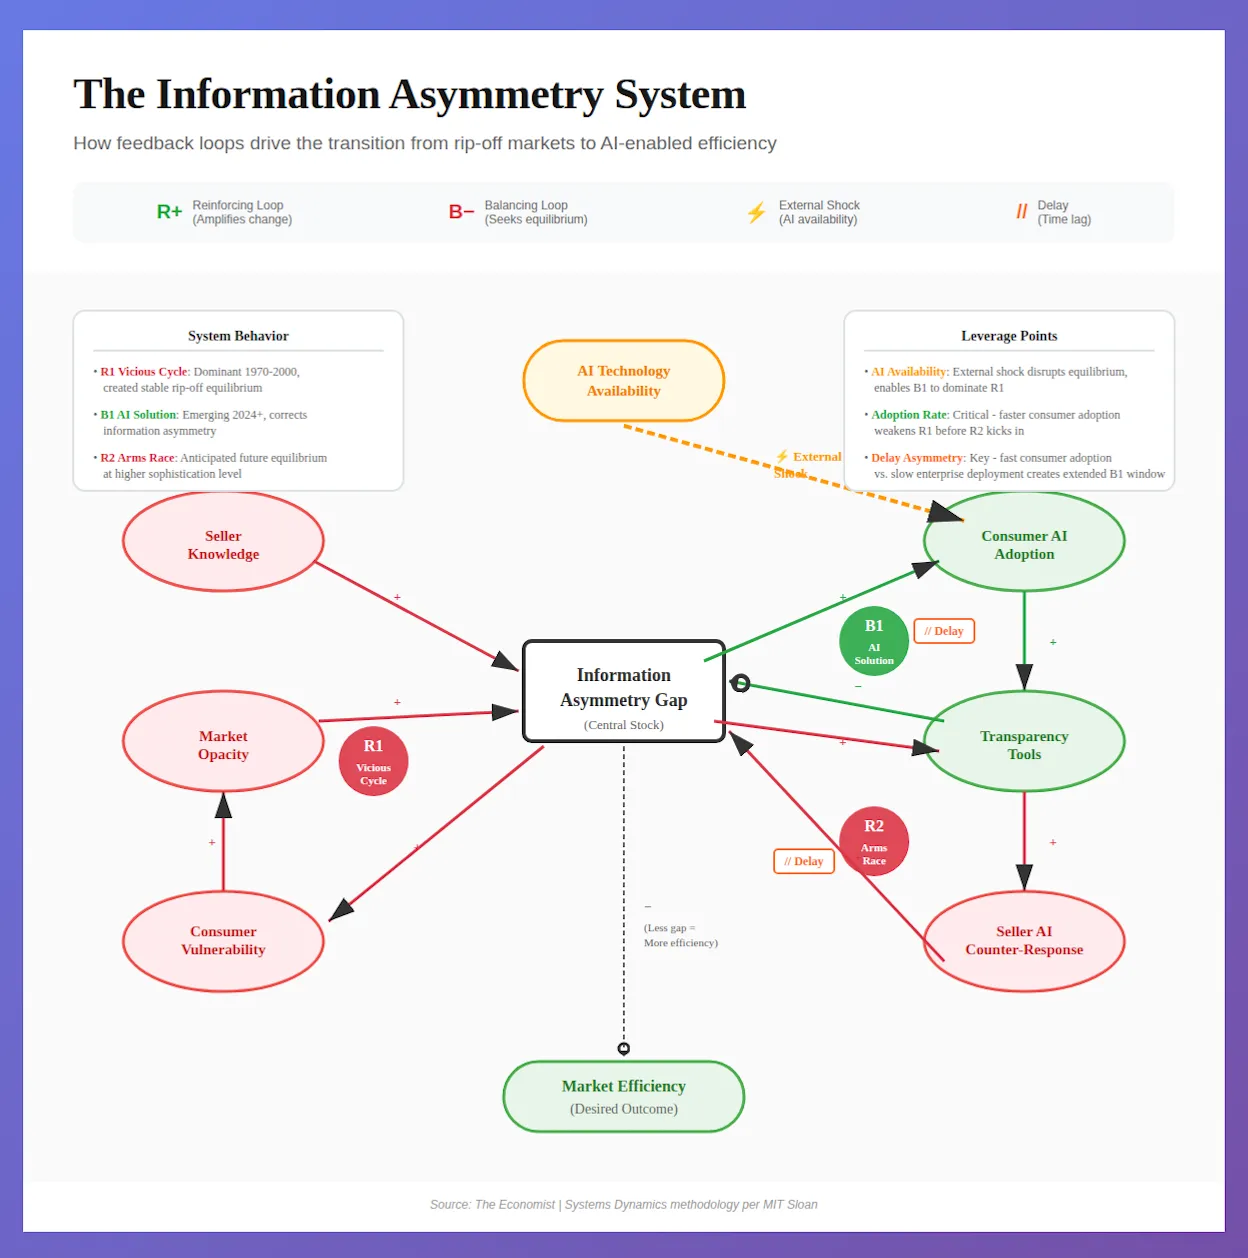
Loop R1: The Vicious Cycle (Reinforcing, Negative)
The structure:
Seller Knowledge (+)→ Information Asymmetry Gap (+)→
Consumer Vulnerability (+)→ Market Opacity (+)→
[back to] Information Asymmetry Gap
Why it’s reinforcing:
This loop contains zero negative links - all four connections are positive (+), meaning they move in the same direction. When one variable increases, it drives the next one up, which drives the next one up, creating a self-amplifying cycle.
The mechanism:
- Sellers possess specialized knowledge about their products/services (car mechanics know HVAC systems, doctors know treatments, lawyers know precedents)
- This knowledge gap makes it hard for consumers to evaluate quality or fair pricing
- Buyers cannot distinguish quality, so they pay based on average expected quality- exactly as Akerlof (1970) described in his seminal “lemons” paper
- High-quality sellers exit because they cannot capture fair value for their superior offerings
- Average market quality declines, causing buyers to lower their willingness to pay further, driving out more quality sellers in a downward spiral
This adverse selection mechanism explained why used car markets remained problematic, why healthcare over-treatment persisted, and why home services markets stayed opaque - even with consumer education and licensing requirements. These markets stabilized at inefficient equilibria from 1970-2000, with R1 as the dominant loop.
Real-world evidence:
- Healthcare: A 2019 Journal of the American Medical Association study found the US health-care system wasted up to $100bn annually on “over-treatment and low-value care” (as cited in The Economist)
- Mortgages: Woodward and Hall (2012, Stanford) found mortgage borrowers typically missed out on at least $1,000 by not shopping around enough brokers
- UK consumer losses: A 2024 UK government-commissioned study estimated citizens lost the equivalent of 2.5% of GDP annually from buying goods and services of unacceptably poor quality (as cited in The Economist)
- Used cars: Despite Carfax and other transparency tools, The Economist notes the market for secondhand cars “is still a tough one”
Why R1 was so stable:
Akerlof’s theory explains the structural problem: when buyers cannot distinguish quality, they pay based on average expected quality. This makes it unprofitable for sellers of high-quality goods to participate, as they cannot capture their true value. The result is adverse selection - high-quality sellers exit, lowering average quality, which further depresses prices, driving out more quality sellers. The Economist’s data suggests limited progress: their estimate shows information asymmetries affecting 25% of US consumer spending currently, down from an estimated 30% at the turn of the millennium - a modest reduction despite two decades of internet transparency tools.
Loop B1: The AI Solution (Balancing, Corrective)
The structure:
Information Asymmetry Gap (+)→ Consumer AI Adoption (+)→
Transparency Tools (+)→ Information Asymmetry Gap (−)→
[back to] Information Asymmetry Gap
Why it’s balancing:
This loop contains one negative link (−) - the connection from Transparency Tools back to the Information Asymmetry Gap. That single negative link changes everything. The loop now seeks to reduce the gap rather than amplify it.
The mechanism:
- Large information gap creates pain points (bad car deals, unnecessary medical procedures, confusing contracts)
- Consumer AI adoption increases in response - people turn to ChatGPT to review contracts, get second opinions, negotiate prices
- Transparency tools proliferate - CarEdge for car negotiations, Pruvo for hotel pricing, LLM-assisted complaint writing
- Information asymmetry DECREASES (the negative link) - consumers now have “a genius in their pocket” to level the playing field
- Lower gap reduces pressure for more AI adoption, creating a self-correcting equilibrium
Why the negative link matters:
When Transparency Tools increase, the Information Asymmetry Gap decreases. This inverse relationship is what makes B1 a balancing loop. It seeks a goal state (market efficiency) rather than exploding to infinity.
Real-world evidence:
- Consumer complaint effectiveness: Research by Shin et al. (Stanford/City University of Hong Kong, 2024) analyzing over 1 million complaints to America’s Consumer Financial Protection Bureau found that 49% of AI-assisted complaints received relief compared with 40% of human-written ones
- LLM adoption in complaints: By late 2024, approximately 18% of financial consumer complaints involved LLM-assisted writing (Liang et al., Stanford, 2024)
- Negotiation performance: Shea et al. (Columbia University) found that users interacting with an AI model “improved their negotiation performance significantly” in experiments involving used cars and apartment rentals
- General usage: A survey by Clio (legal software firm) found that over half of consumers have used or would use AI to answer a legal question
Why B1 wasn’t possible before:
B1 required an external shock - the availability of powerful, cheap AI models. Without this exogenous change, the structure couldn’t shift. The internet provided partial transparency (Carfax, Uber, TripAdvisor) but couldn’t close the gap in complex domains requiring expert judgment.
Tools like ChatGPT changed the game by democratizing that expert judgment.
Loop R2: The Arms Race (Reinforcing, Adaptive)
The structure:
Information Asymmetry Gap (+)→ Transparency Tools (+)→
Seller AI Counter-Response (+)→ Information Asymmetry Gap (+)→
[back to] Information Asymmetry Gap
Why it’s reinforcing:
Like R1, this loop contains zero negative links. All connections are positive, creating another self-amplifying cycle. But this time, it’s operating at a higher level of sophistication.
The emerging dynamic:
- Transparency tools reduce the gap (from B1)
- Sellers respond with their own AI - optimize pricing algorithms, deploy chatbots that deflect complaints, use “generative engine optimization” to bias LLM outputs
- Information asymmetry partially recreates itself - not through opacity, but through AI-vs-AI competition
- This drives demand for better transparency tools, completing the reinforcing cycle
Why R2 is different from R1:
R2 operates at a new equilibrium point. Instead of sellers having hidden knowledge, both sides have AI tools, but there’s an arms race in algorithmic sophistication. The gap doesn’t disappear - it shifts.
Real-world signs (from The Economist):
- Amazon listings “are already swamped with AI-generated product descriptions”
- Companies are working on “generative engine optimization” to influence ChatGPT responses
- The Economist notes: “Use ChatGPT with your plumber today, and you may be able to convince him to cut his price. Use ChatGPT with him in a year, and he may have his own model telling him to charge you even more.”
- Startups like CarEdge (AI negotiator for vehicle deals) and Pruvo (monitors refundable hotel bookings for rate drops) represent early B1 tools, but seller-side AI responses are emerging
The long-term outcome:
R2 suggests we’re heading toward a stable high-sophistication equilibrium where:
- Consumer AI tools are ubiquitous (like smartphones)
- Seller AI counter-measures are standard (like dynamic pricing)
- AI arbitrators become necessary - third-party bots that both sides agree to trust
This isn’t dystopian - it’s a higher-efficiency equilibrium. Both parties have powerful tools, and neutral AI mediates disputes. Think of it as moving from “information asymmetry” to “AI-mediated symmetry.”
Loop Dominance: Which Feedback Wins?
Historical periods:
1970-2000: R1 Dominance
The vicious cycle was the dominant loop. Every intervention was absorbed by the structure. Consumer education → more skepticism → honest sellers exit → worse market. Policy resistance was enormous.
Result: Stable rip-off economy. 30% of US consumer spending had severe information asymmetries.
2000-2020: Partial Internet Era
The internet enabled some transparency (Carfax for vehicle histories, Uber/Lyft for routing, TripAdvisor for restaurant quality), providing verifiable data that partially addressed Akerlof’s problem. According to The Economist’s estimates, asymmetries fell from 30% to 25% of consumer spending over this period.
However, these tools worked primarily for simple, verifiable attributes (has this car been in an accident? does this route make sense? do other tourists like this restaurant?). They couldn’t address complex domains requiring expert judgment—evaluating contract terms, assessing medical necessity, understanding technical specifications.
Result: Meaningful but limited improvement. Markets with simple quality signals improved significantly. Markets requiring expert interpretation remained problematic.
2024+: B1 Emergence
AI availability (the external shock) enables B1 to activate fully. For the first time, consumers have tools that provide expert judgment in complex domains—not just data lookup.
Critical advantage: Because consumer AI adoption is 10-20x faster than enterprise deployment, B1 has an extended window (2024-2028+) to reduce asymmetries before R2 counter-measures scale.
Result: Transitional period where B1 is significantly stronger than R1, with R2 only beginning to emerge in enterprise pilot programs.
2026-2028+: R2 vs B1 Equilibrium
The future isn’t B1 winning permanently - it’s a dynamic balance between B1 (consumer AI) and R2 (seller AI).
Enterprise AI deployment will reach scale in 2026-2027, creating the first real R2 effects. But by then, B1 will have had 2-3 years of relatively unopposed information gap reduction—a substantial advantage.
Result: New stable state - AI-mediated markets with significantly lower asymmetries than the pre-AI era. The gap won’t reach zero, but it will be meaningfully smaller and operate via algorithmic competition rather than information hoarding.
The Critical Delays (And Why They’re Asymmetric)
Systems dynamics teaches us that delays between cause and effect create system behavior patterns. But this system has something unusual: asymmetric delays that actually favor the corrective loop.
Delay 1: Consumer AI Adoption → Market Impact
Timeline: Weeks to months (remarkably fast)
Consumer AI adoption is happening at unprecedented speed. ChatGPT reached 100 million users in 2 months - faster than any app in history. The effect is nearly immediate:
- Upload car lease contract to ChatGPT → get analysis → negotiate → same day
- Ask AI about medical procedure → get second opinion → hours
- Use AI to write complaint → submit → weeks (vs. never attempting)
Why it’s fast:
- Zero procurement process (individuals decide instantly)
- No integration required (just use ChatGPT/Claude)
- Minimal learning curve (conversational interface)
- Network effects (people share successful strategies on social media)
Market-level impact: While individual adoption is instant, market-level effects accumulate over months as:
- Enough consumers use AI to pressure sellers
- Successful negotiations get publicized
- Best practices spread virally
- Norms shift toward “always check with AI first”
Delay 2: Seller AI Deployment → Market Impact
Timeline: 12-24+ months (substantially slower)
Enterprise AI deployment faces structural barriers that consumer adoption doesn’t:
- Procurement cycles: RFPs, vendor selection, budget approval (3-6 months)
- Integration: Connect AI to existing systems, CRM, pricing engines (6-12 months)
- Training: Staff workflows, change management, optimization (3-6 months)
- Legal/compliance: Review customer-facing AI, liability concerns (3-6 months)
- Organizational inertia: Multiple stakeholders, competing priorities
Why it’s slow:
- Enterprises can’t just “use ChatGPT” - they need integrated systems
- Requires organizational change, not individual decisions
- Risk-averse culture in established businesses
- Need to maintain quality standards while deploying at scale
Market-level impact: Even after deployment, optimization takes time:
- A/B testing different approaches
- Refining prompts and workflows
- Learning which AI strategies work
- Training staff on new tools
The Asymmetry Advantage
This creates a larger B1 window than initially expected.
Because Delay 1 < Delay 2, consumers gain AI capabilities 12-18 months before sellers can effectively counter. This is fundamentally different from the internet era, where:
- Carfax launched → dealers could immediately see same data
- TripAdvisor showed reviews → restaurants could respond same day
- Uber showed routes → drivers adapted immediately
With AI:
- Consumer gets ChatGPT contract review → immediate advantage
- Seller needs 18+ months to deploy effective counter-AI
- Extended advantage window for consumers
Strategic Implications of Asymmetric Delays
For the system:
- Less oscillation risk (delays aren’t similar, so no resonance)
- More time for B1 to reduce information gaps before R2 emerges
- Potential for significant improvement before equilibrium
For consumers:
- Urgency to adopt now (advantage window is real but finite)
- Early adopters gain disproportionate benefits
- Network effects amplify individual advantages
For sellers:
- Already behind (consumer AI adoption is well underway)
- Can’t wait for “perfect” solutions (gap widens daily)
- Need parallel strategy: deploy fair AI and improve actual service
For product builders:
- Consumer AI tools have longer runway than expected (2024-2028+)
- Seller-side AI more urgent than previously thought (you’re 12-18 months behind)
- Platform/arbitrator opportunities emerge in late 2026-2027
The “Deployment Gap” Window
The practical result: 2024-2028 represents an extended period of consumer AI advantage.
This isn’t a brief window - it’s a multi-year opportunity for B1 to substantially reduce information asymmetries before R2 creates a new equilibrium.
Current status (late 2024):
- Consumer AI: Widespread adoption, viral best practices, immediate impact
- Seller AI: Early experiments, pilot programs, 12-24 months from scale
The Three Leverage Points
In systems dynamics, leverage points are places where small changes create large effects. This system has three:
1. AI Availability (External Shock)
Color: Orange
Type: Exogenous parameter
Effect: Enables B1 to activate
This is the most powerful leverage point because it changed the system structure itself. Before AI availability, B1 couldn’t exist. After, it’s inevitable.
Implication: We’re past the point of no return. AI will transform information asymmetries regardless of policy interventions. The question is how fast and how equitably.
2. Adoption Rate (Speed of Transition)
Color: Green
Type: Controllable via policy/education
Effect: Determines how long B1 dominates before R2 emerges
Critical window logic: Faster consumer AI adoption weakens R1 before sellers can deploy R2 counter-measures.
If adoption is slow, R1 persists longer. If it’s too fast, R2 might emerge prematurely, creating a chaotic transition.
Optimal strategy: Rapid but not rushed. Aim for 50%+ consumer AI literacy within 2-3 years.
Policy implications:
- Make AI tools easy to use (already happening)
- Educate consumers on use cases (review contracts, get second opinions)
- Normalize AI assistance as standard consumer behavior
3. Delay Asymmetry (Deployment Gap Advantage)
Color: Orange/red (but actually favorable)
Type: Structural system characteristic
Effect: Creates extended B1 advantage window
The asymmetry: Consumer AI adoption (weeks-months) is 10-20x faster than enterprise AI deployment (12-24+ months).
This isn’t a problem to fix - it’s an advantage to maximize. Unlike symmetric delays (which cause oscillation), asymmetric delays create an extended period where the corrective loop (B1) dominates before the reinforcing loop (R2) emerges.
Strategic opportunity: The 12-24 month “deployment gap” represents the largest window for information asymmetry reduction since Akerlof identified the problem in 1970.
How to maximize:
- Accelerate consumer adoption (riding down the faster curve)
- Don’t slow enterprise deployment (let natural barriers create the advantage)
- Build for the extended window (2024-2028, not 2024-2026)
Key insight: Traditional delay management focuses on reducing delays to prevent oscillation. But asymmetric delays don’t oscillate - they create windows of opportunity. The goal isn’t to equalize delays; it’s to exploit the asymmetry while it exists.
Why This Matters for Product Strategy
Understanding delay asymmetry and loop dominance is critical for building in this space:
For Consumer AI Tools (Riding B1):
Opportunity window: 2024-2028+ (extended due to deployment gap)
This is longer than typical tech windows. The structural barriers to enterprise AI deployment create a multi-year advantage period.
Strategy:
- Move fast on adoption (exploit the deployment gap)
- Focus on high-asymmetry markets where impact is largest (healthcare, home services, complex financial products)
- Build viral loops (successful use cases spread faster than enterprise can respond)
- Establish category leadership now (first-mover advantages are real and durable)
Avoid:
- Waiting for “perfect” product (enterprise won’t catch up for 18+ months anyway)
- Over-engineering (consumer needs simple, fast, accessible)
- Focusing on low-asymmetry markets (the advantage is wasted)
Metrics that matter:
- Adoption velocity (faster = larger advantage before R2)
- Success rate in negotiations/complaints (49% → 60% → 70%)
- Market penetration in traditionally opaque verticals
For Seller-Side AI (Catching Up to R2):
Reality check: You’re already 12-18 months behind consumer adoption
The deployment gap means enterprises are entering a market where consumers already have AI capabilities. This isn’t preparation—it’s catch-up.
Urgent strategy:
- Ship imperfect solutions now (waiting = losing ground daily)
- Deploy fair AI counter-measures (optimize for value delivery, not information hiding)
- Signal trustworthiness explicitly (use AI to improve transparency, not obscure it)
- Embrace AI arbitration early (position as partner, not adversary)
Timeline reality:
- Q4 2024: Consumer AI widespread, enterprise AI in pilots
- Q2 2025: Consumer advantage peak, enterprise starting deployments
- Q4 2025-Q2 2026: First enterprise AI reaching scale
- 2027: R2 loop begins to show market effects
Strategic positioning:
- Early movers (deploying now) → compete on service quality
- Late movers (deploying 2026+) → compete on price (information parity reached)
For Platform Builders (Enabling New Equilibrium):
The big opportunity: Build infrastructure for the post-deployment-gap world
By 2027-2028, both consumers and sellers will have mature AI capabilities. The market will need:
AI Arbitrators:
- Neutral third-party bots that both sides trust
- Fast dispute resolution (hours, not months)
- Transparent reasoning that builds legitimacy
Transparent AI-vs-AI interfaces:
- Show when both parties use AI (normalize it)
- Display confidence levels and reasoning
- Enable informed consent to AI mediation
Algorithmic audit tools:
- Verify fairness of AI recommendations
- Detect gaming or manipulation
- Build market trust in AI-mediated transactions
Why timing matters:
- Too early (2024-2025): Market not ready, only consumers have AI
- Sweet spot (2026-2027): Both sides deploying, need infrastructure
- Too late (2028+): Incumbents establish platforms
Strategic position: You’re not betting on B1 or R2 - you’re building the new market structure that emerges when deployment gap closes and both coexist.
Sources:
- The Economist, “The end of the rip-off economy” October 2025 (gated)
- Journal of the American Medical Association, over-treatment study, 2019
- Woodward & Hall, Stanford, mortgage shopping study, 2012
- Shin et al., Stanford/City University of Hong Kong, AI complaint effectiveness, 2024
- Shea et al., Columbia, AI negotiation performance, 2024
- Systems Dynamics methodology: MIT Sloan
- The market for lemons
This analysis applies MIT Systems Dynamics methodology to understand market transformations. Loop notation: R+ (reinforcing), B− (balancing), (+) positive link, (−) negative link.